Written by


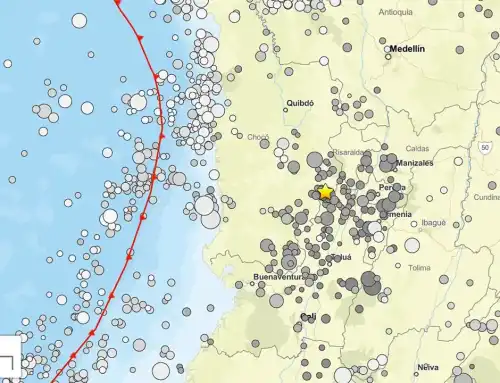
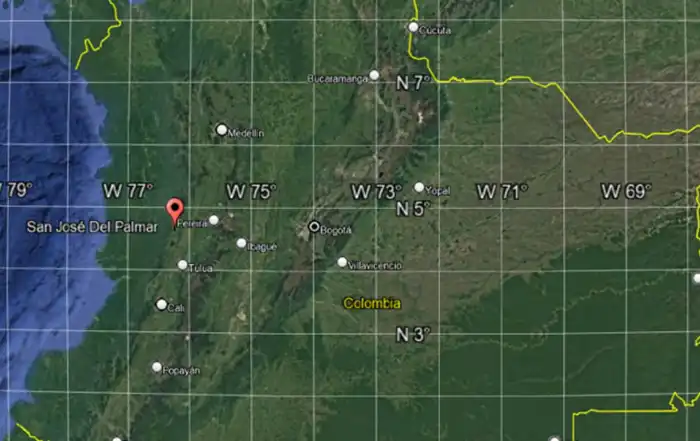
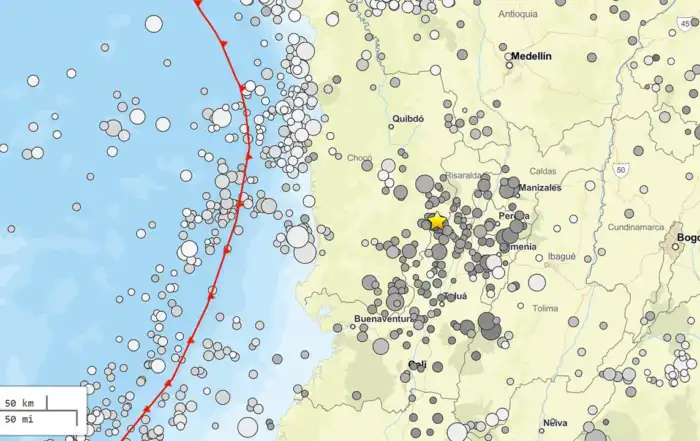
On August 10, 2026, at 7:34 a.m. local time, Colombia was struck by a magnitude 7.4 earthquake, with its epicenter located in the municipality of San José del Palmar, Chocó Department. The Colombian Geological Survey (SGC)—the country’s official authority on seismic activity—reported a depth of 103 km and located the event at coordinates 4.99° N latitude and 76.29° W longitude. The United States Geological Survey (USGS) also reported a magnitude of 7.4, although it estimated a slightly greater depth of 107 km.
Figure 1. Relative location of San José del Palmar
Source: Google Earth
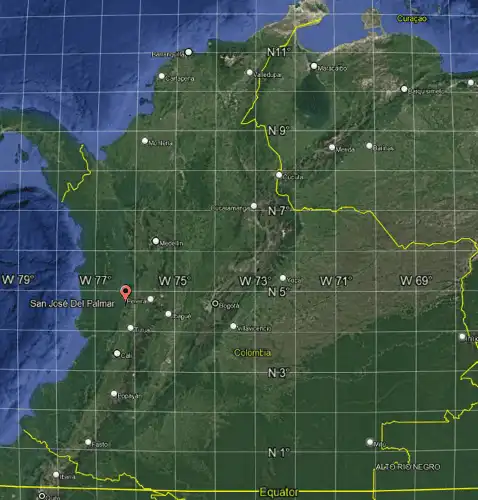
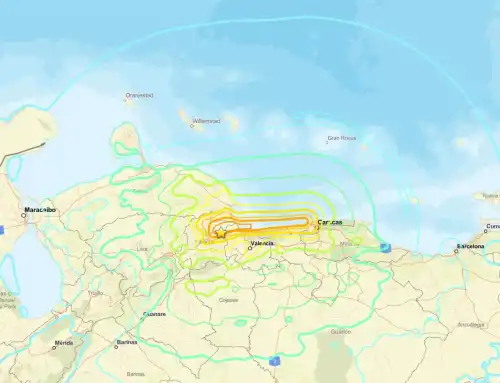
Figure 2. Seismic event report
Source: Colombian Geological Survey (SGC)
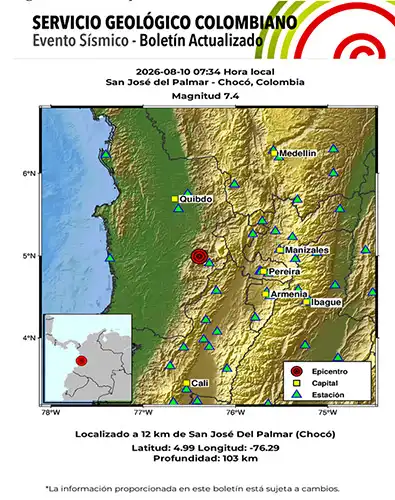
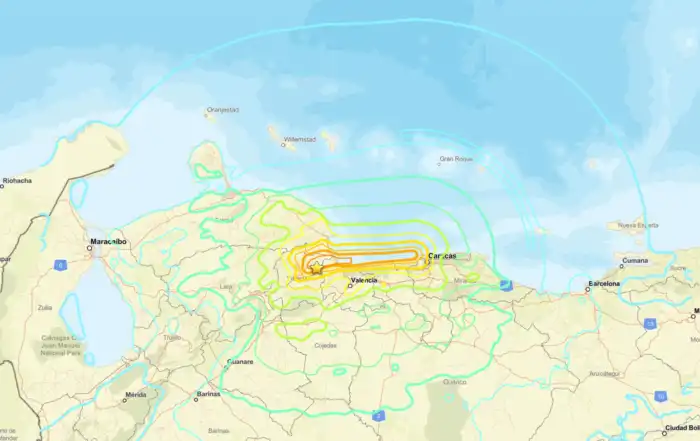
The mainshock was instrumentally recorded for approximately 90 seconds to 2 minutes by the monitoring stations closest to the epicenter. The earthquake was strongly felt in cities including Cali, Pereira, Manizales, Bogotá, Armenia, Medellín, and Popayán, with reports also received from Panama and Venezuela.
The SGC confirmed that this was the highest-magnitude earthquake recorded in Colombia so far in the 21st century. The event was caused by the subduction of the Nazca Plate beneath the South American Plate, a tectonic interaction characteristic of Colombia’s Pacific region. Authorities ruled out a tsunami threat along the Colombian Pacific coast.
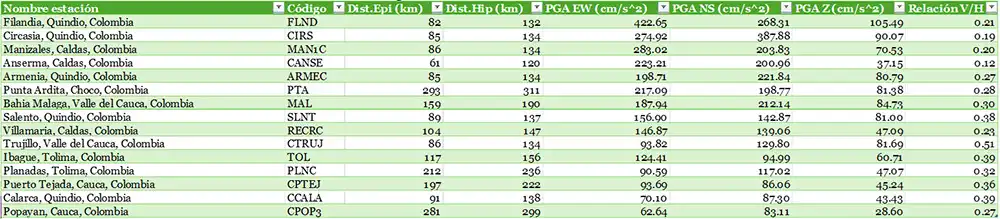
According to the most recent update from the National Unit for Disaster Risk Management (UNGRD), dated August 25, 2026, the earthquake resulted in the following impacts:
Table 1. Summary of earthquake impacts
Affected infrastructure includes:
- 378 health centers
- 3,731 educational centers
- 4,170 community centers
- 441 roads
- 5 airports
- 118 aqueducts
- 73 vehicular bridges
- 16 pedestrian bridges
In addition, 5,884 buildings were damaged and 603 collapsed.
SEISMIC RECORDS
The mainshock of August 10, 2026, was recorded by stations belonging to the Red Sismológica Nacional de Colombia (RSNC) and the Red Nacional de Acelerógrafos de Colombia (RNAC) networks that are operated by the Colombian Geological Survey (SGC). To date, 86 records have been obtained. Table 2 presents the stations that recorded the highest accelerations.
Table 2. Seismic records with the highest accelerations
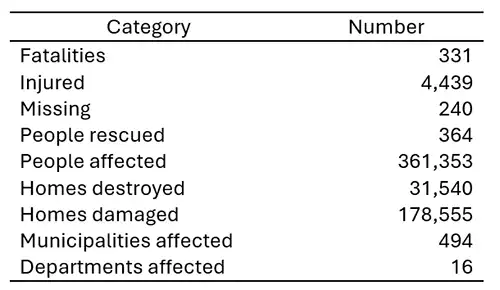
The FLND station in Filandia recorded the highest horizontal acceleration during the event, reaching acceleration values close to 0.5g. The Anserma station (CANSE) that is closer to the epicenter—61 km compared with 82 km for Filandia—recorded a lower acceleration of approximately 300 cm/s². This difference indicates a pronounced site effect, or local amplification, in the Filandia area and the wider Coffee Triangle region, likely associated with volcanic ash deposits and soft soils that amplify seismic waves. In most of the records the duration of the strong motion was high (sometimes more than 60 seconds) indicating the large magnitude of the earthquake.
The vertical component (Z) is notably lower than the horizontal components. For the peak values, the vertical-to-horizontal ratios were approximately:
- Filandia: 21% of the horizontal component
- Circasia: 19% of the horizontal component
These ratios, which are broadly consistent with typical values of approximately 0.2 to 0.3, indicate that the predominant ground motion was horizontal, as is characteristic of S-waves and surface waves associated with intermediate-depth earthquakes. No anomalous vertical peaks were observed that would suggest significant liquefaction effects or near-surface tectonic uplift.
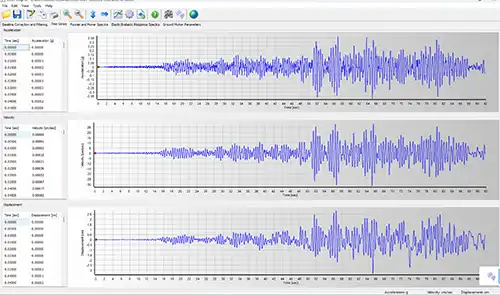
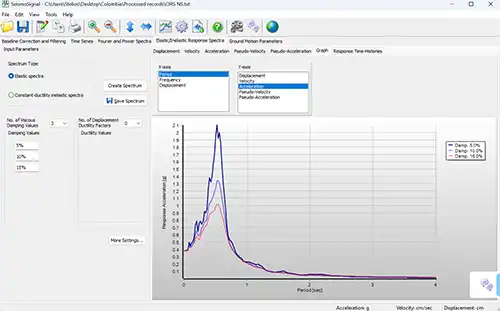
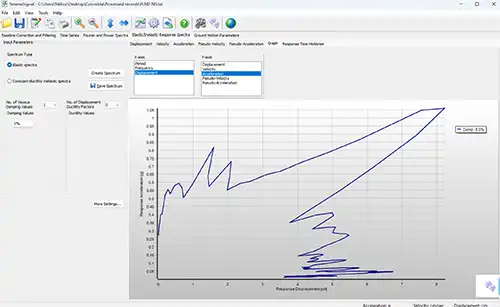
The Seismosoft team imported several of the recordings into SeismoSignal and SeismoSignal 3D and generated the response spectra for the X, Y, and Z directions, the more important strong motion parameters (Acceleration/Velocity/Displacement RMS, Characteristic Intensity, Arias Intensity, Housner Intensity, Specific Energy Density, Cumulative Absolute Velocity, Significant and Uniform Duration), as well as the RotD100 and RotD50 spectra. The results were particularly noteworthy. In some cases, the spectral acceleration exceeded 2.0 g, and the Significant durations of the signal reached values of more than 50 seconds.
Figure 3. Screenshots from SeismoSignal 3D
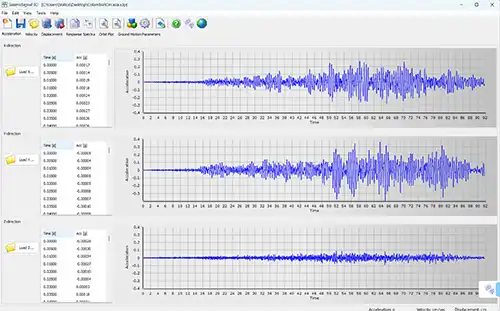
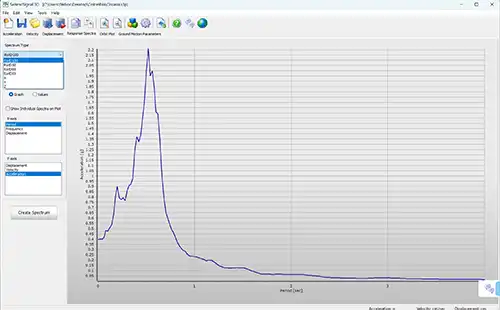
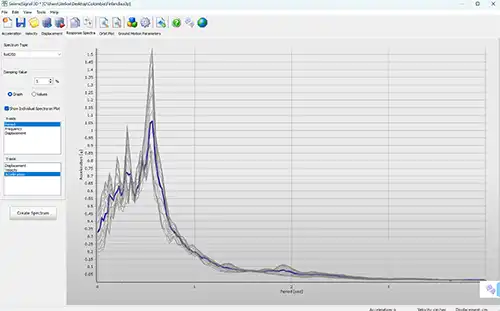
Figure 4. Screenshots from SeismoSignal
Several recordings are available from the Colombian Geological Survey (SGC), which is gradually releasing the corrected acceleration time histories.