

![]()
In the context of seismic assessment and retrofit of existing reinforced concrete buildings, practitioners prefer to employ linear analysis and in particular the Linear Dynamic Procedure that uses the well-known Response Spectrum Analysis. This is attributed mainly to the fact that engineers are more familiar with this method, which is the one mostly employed in the design of new structures, but also because linear analysis is easier and faster to use.
In the design of new structures, the approximations of elastic analysis do not constitute a significant problem, since engineers are able to choose the strength and stiffness characteristics of the structural components, in order to have a reasonable distribution of inelasticity, without large concentrations of deformations at particular, more vulnerable locations of the building.
On the contrary, this is rarely the case in the context of the seismic assessment and retrofit of existing structures. Older buildings have been designed and constructed before the introduction of the early earthquake resistance codes, without special considerations to withstand seismic actions in a manner similar to today’s practice. As a result, very frequently they exhibit irregular arrangement of their structural members, with uneven distribution of the strength, stiffness and mass, which adversely affects its behavior under earthquake loading (e.g. irregularities in plan or elevation, soft ground stories, short columns, coupling beams between large shear walls, indirect supports on beams etc.).
Because of this behavior, the use of elastic procedures for the analysis of existing buildings may lead to serious inaccuracies in the estimation of the force and the deformation demand on the structural components, especially in the locations with concentrations of inelastic deformations that are the most vulnerable under seismic loading. In order to overcome all these problems, all the standards for structural assessment have proposed larger safety factors for the linear methods and procedures that are very conservative.
In the present article, it will be demonstrated that, despite the obvious advantages of linear analytical methods, their use in the assessment and strengthening of older RC structures is a very conservative practice that should be avoided. By means of examples and real case-studies that are analyzed with the full code-based seismic assessment methodologies, according to both ASCE 41 and Eurocode 8, it will be explained why the nonlinear methods, combined with a good knowledge of the structural configuration, can be very beneficial, lead to lighter interventions and prevent unnecessarily disruptive and costly works. Similar conclusions have also been drawn by other recent studies [1, 2, 3, 4].
LINEAR AND NONLINEAR METHODS OF ANALYSIS
Within the context of all modern codes for structural assessment and retrofit, four different analytical methods are proposed with small variations between the different standards:
- The Linear Static Procedure LSP, a static type of analysis with no variable load.
- The Linear Dynamic Procedure LDP, which is essentially the Response Spectrum Method (RSA), which is the method mostly employed for the design of new structures; thus, it is the method of analysis that engineers are more familiar with.
- The Nonlinear Static Procedure NSP, which is the well-know pushover analysis.
- The Nonlinear Dynamic Procedure NDP, which is the nonlinear dynamic time-history analysis.
Applicability of the different analytical methods
Linear Static Procedure: The LSP is the most basic method of the four with many approximations and very limited accuracy, even for relatively simple structural configurations. It is only allowed for small symmetric buildings, and it is employed in a conservative manner with large safety factors. In general, it should be avoided for everyday application, but for the most simple and regular buildings.
Linear Dynamic Procedure: Because the loading is calculated through the combinations of several modes (including higher ones), the LDP is suitable for tall and asymmetric buildings, where higher mode effects are of importance. However, as an elastic method, it inherently has limited accuracy in the case of large inelastic deformations, which are very common in existing buildings under large earthquake loading. Hence, the results can be very inaccurate when applied to buildings with highly irregular structural systems, unless the building is capable of responding almost elastically at the selected Seismic Hazard Level. Similarly to the LSP, it is employed conservatively with higher safety margins, in comparison with the nonlinear methods.
Nonlinear Static Procedure: Due to the explicit modelling of inelasticity, the NSP is more suitable when large inelastic deformations are expected. In such cases, the structural response can be modelled with satisfactory accuracy, allowing for a less conservative approach. The NSP is generally a more reliable approach for characterizing the performance of a structure than the linear procedures. However, it cannot accurately account for changes in dynamic response as the structure degrades, and it is not suitable, when higher-mode effects are of importance, e.g. with taller buildings (more than 10-15 floors). In general, the NSP is a valid approach for the seismic assessment of existing buildings; however, it should be used with some caution, when the structural response is determined by more than one modes.
Nonlinear Dynamic Procedure: The nonlinear dynamic time-history analysis involves fewer assumptions than the nonlinear static procedure, and it is the most sophisticated method for structural analysis. It is more accurate than the NSP, and it is subject to fewer limitations regarding the load and the structural configuration. The NDP is able to model both the inelastic material behavior and higher mode effects for a given earthquake record. It directly provides the maximum global displacement demand produced by the earthquake on the structure, eliminating the need for approximations, and it is generally suitable for any structural configuration and any earthquake loading. However, the main disadvantage of the method is a significant one: it is relatively difficult to use, and specialized knowledge is often required, e.g. for the selection of suitable accelerograms, or the interpretation of results.
CODE-BASED CHECKS AND ACCEPTANCE CRITERIA
As in the standard design methodologies, the requirement of the capacity checks is that the component strength is larger than the demand on the component, i.e.:
QC ≥ QU for ASCE 41, or Rd ≥ Ed for the Eurocodes
QU or Ed is the design value of the action effect for the seismic design situation for the selected hazard level, and QC or Rd is the corresponding resistance of the element.
A basic distinction is done in both standards between the deformation-controlled, ductile actions (e.g. bending in a member without significant axial loads) and the force-controlled, brittle actions (e.g. shear). Different approaches are followed for the capacity checks in the two cases, as will be described below.
Capacity checks for linear methods
When using the linear methods of analysis, the checks are always performed in terms of forces for both the deformation and the force-controlled actions. For the ductile mechanisms of failure, inelasticity is taken into account in the two codes in a similar, but not exactly the same way. In ASCE 41, inelasticity is taken into account by the so-called m-factors, whereas in Eurocode 8 it is considered with the selected behavior factor q. The philosophy of both factors is the same, i.e. to account for the capability of ductile members to deform beyond their yield point. However, there are two main differences between the q and the m-factors. The most important difference is that, whereas the m-factors are member specific (i.e. different m-factors may be assigned to the different structural components), the q-factor is based on the entire capability of the building to absorb energy. Secondly, the m-factors operate on the capacity side of the inequality, effectively increasing the strengths, whereas the q-factor is employed to decrease the demand on the components (both factors assume values equal or larger to unity).
Component Demands: For the deformation-controlled actions the component demand is calculated from the set of linear analyses. For the force-controlled actions the component demand is calculated based on capacity design considerations (i.e. estimate of the maximum action that can be developed in a component, based on a limit-state analysis), taking into account the expected strength of the components that deliver forces to the component under consideration. This is done in order to make sure that a failure in the force-controlled action is avoided. For example the shear demand on a column is not considered directly from the analytical calculations, but rather by the expected bending capacity of the member at its two edges, which is often very conservative.
Component Capacities: For the deformation-controlled actions the capacity of the components shall be based on the expected strengths. On the contrary, for the force-controlled actions the capacities shall be based on lower-bound strengths.
Capacity checks for nonlinear methods
Component Demands: For the deformation-controlled actions the quantities checked are deformations (rather than forces), as these are calculated from the nonlinear analysis. For the force-controlled actions, the component demands are again forces, but now they are calculated directly from the nonlinear analysis. It is stressed that the demands are not to be determined from capacity design considerations as in the linear case, since inelasticity is explicitly accounted for by the nonlinear analysis method, and the calculations are significantly more accurate.
Component Capacities: For the deformation-controlled actions the component capacities are taken as permissible inelastic deformation limits at the target displacement. For the force-controlled actions, the component capacities are taken as lower-bound strengths at the target displacement. Contrary to the deformation-controlled actions, the checks for the force-controlled actions are performed again in terms of forces.
APPLICATION EXAMPLES
In order to investigate the effect that the method of analysis has on the outcome of the structural assessment and retrofit methodologies, two application examples will be examined. The first example refers to the assessment of an industrial building with short columns, whereas the second example is a real case study with the strengthening of a small residential building with a soft ground floor that has been severely damaged from two consecutive earthquakes. All the analyses and all the checks have been carried out with SeismoBuild, a package dedicated to the seismic assessment and strengthening of existing buildings, which is capable of performing linear and nonlinear, static and dynamic analysis. More information on the two examples can be found at [1].
ASSESSMENT OF AN INDUSTRIAL BUILDING WITH SHORT COLUMNS
In the current section the structural assessment and strengthening of an industrial building with short columns will be presented. The building is a typical design of the late 1980s and it consists of two rectangular floors of approximately 880m2 each (Figure 1).
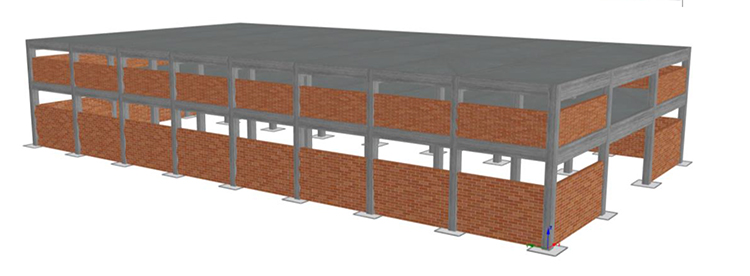
Figure 1: 3D rendering of the industrial building
The concrete grade is C16/20, the steel grade is S400 for longitudinal bars and S220 for the stirrups. There is adequate longitudinal reinforcement (e.g., 8∅20 rebars in the columns), however the shear reinforcement is just Φ8/15 for the beams and Φ8/30 for the columns. The infilled walls form a series of vulnerable, short columns in the entire building perimeter. These short columns are the most important characteristic of the building and constitute a serious structural problem related to its seismic behavior.
The building will be analyzed according to ASCE 41 and ACI 369.1 for a single Performance Objective ‘g’ (see Table C2-8 in ASCE 41-23), which combines the (3-C)
Performance Level for Life Safety, and the BSE-1E Seismic Hazard Level with a 20% probability of exceedance in 50 years.
Code-based checks in shear and bending for all the members were carried out. Bending is a deformation-controlled (ductile) failure mechanism, for which reason the checks were performed in terms of forces (bending moments) for the linear analyses, but in terms of the plastic hinge rotation in the nonlinear methods. All the checks are expressed in terms of the demand-to-capacity ratio (DCR) for every member. The DCR is the proportion, by which the demand is larger than the capacity; if DCR<1 the member is safe, if instead DCR>1 the member fails.
Capacity checks with the Nonlinear Static Procedure, NSP
The checks have been carried out for both shear and plastic hinge rotation for all the members. No failures have been observed for the checks in plastic hinge rotation, and the maximum DCR ratios was 0.536.
On the contrary several failures were observed in the shear checks. As expected, almost all the failures were located at the short columns in the perimeter, confirming the fact that lightly reinforced short columns are indeed an element of increased vulnerability in existing buildings. DCRs range from 1.236 to 1.431 in the ground floor, and from 1.040 to 1.274 in the second floor (Figure 2). In total 44 members have failed.
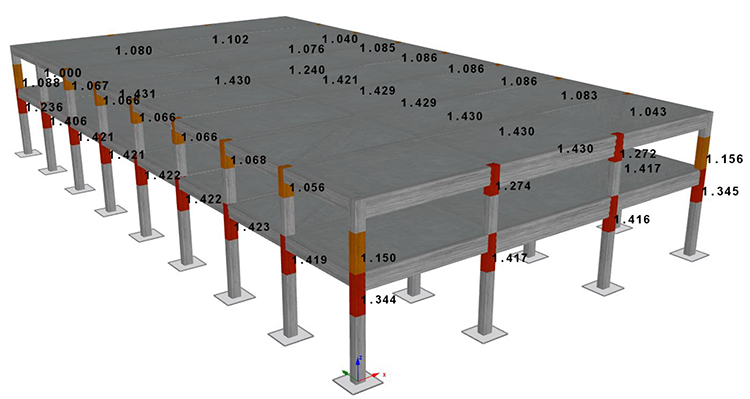
Figure 2: Shear checks with the Nonlinear Static Procedure, NSP
Capacity checks with the Linear Dynamic Procedure, LDP
The 8 linear dynamic analyses required by ASCE-41 ran faster than the 8 pushover analyses (3 seconds, instead of 27 seconds in an average Intel i7 processor – both sets of analyses were executed using the advanced parallel computational capabilities of SeismoBuild). However, the shear demand with LDP on the short columns is considerably higher (up to 664 kN with LDP, with respect to a maximum of 285 kN with NSP). It is noted that shear is a brittle type of failure and the demand is calculated with capacity design considerations. taking into account the expected strength in bending of the components that deliver forces to the component. This is done, in order to make sure that a failure in the force-controlled action is avoided, since the results from the elastic analyses are expected to be quite inaccurate.
The higher demand is obviously reflected on the results of the capacity checks in shear. The maximum demand-to-capacity ratio in shear is now 5.17, and almost all structural members fail (Figure 3). In total 112 members have failed, all 72 columns and 40 of the beams.
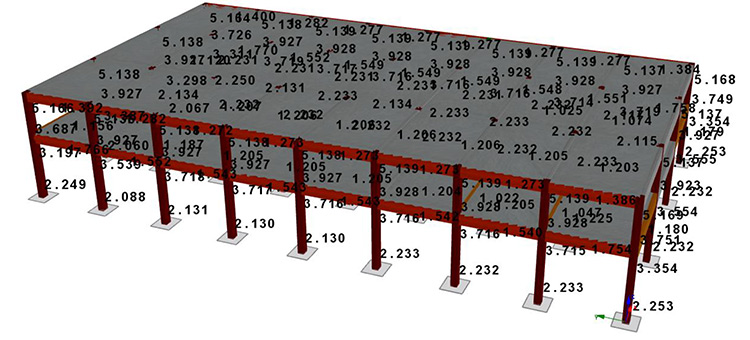
Figure 3: Shear checks with the Linear Dynamic Procedure, LDP
Bending is a ductile action, and the checks in the linear methods are carried out in terms of bending moments, which is usually more conservative. This is highlighted in Figure 4 that shows the bending checks. Whereas with pushover analysis, no failures are observed (the maximum DCR is equal to 0.536), with the linear dynamic procedure 59 failures occur and the maximum DCR is equal to 2.678.
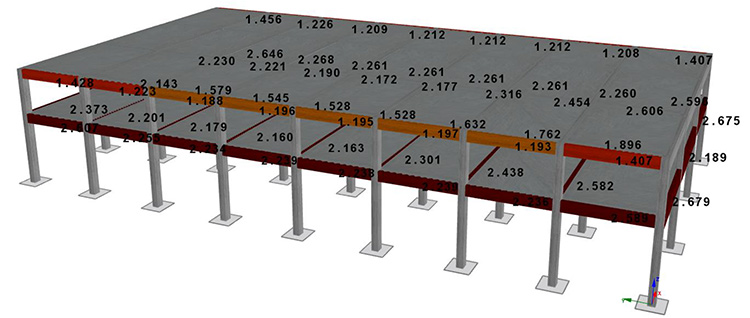
Figure 4: Bending checks with the Linear Dynamic Procedure, LDP
Capacity checks with the Nonlinear Dynamic Procedure, NDP
The Nonlinear Dynamic Procedure is generally more expensive in terms of computational resources (NDP: 7 minutes and 18 seconds for 11 dynamic analyses. NSP: 27 seconds for 8 pushover analyses). One additional complication with the NDP is the selection, scaling or matching to the target spectrum of the accelerograms, with which the dynamic analyses are run. Note however that in the case of SeismoBuild this process does not pose a significant challenge, since SeismoBuild utilizes several SeismoArtif algorithms for the automatic creation of artificial accelerograms that match the acceleration spectrum for the different seismic hazard levels.
These complications however are compensated with more accurate, and less conservative results. Now the maximum demand-to-capacity ratio is now 1.309, which is 9% less than the 1.431 value of the maximum DCR in the NSP. Moreover, only 20 members have failed, as opposed to the 44 members that failed with pushover analysis (Figure 5). The additional computational cost pays off with more accurate and less conservative results, and consequently lighter structural interventions for the seismic strengthening.
Regarding the bending checks, again no failures have been observed in plastic hinge rotation, as in the case of the nonlinear static procedure. However, the DCR ratios are now decreased; 0.326 in the NDP as opposed to 0.536 in the NSP.
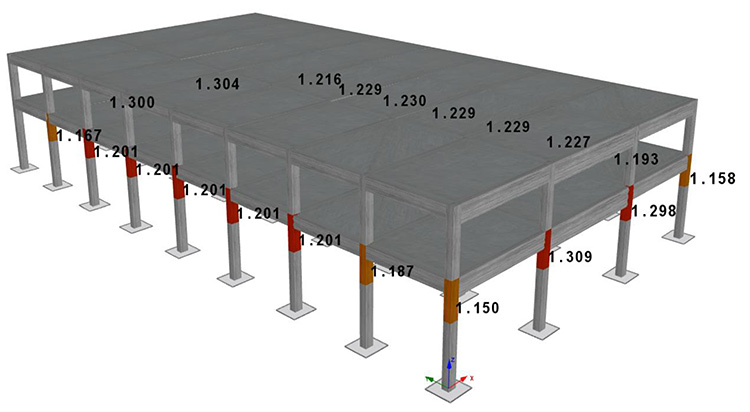
Figure 5: Shear checks with the Nonlinear Dynamic Procedure, NDP
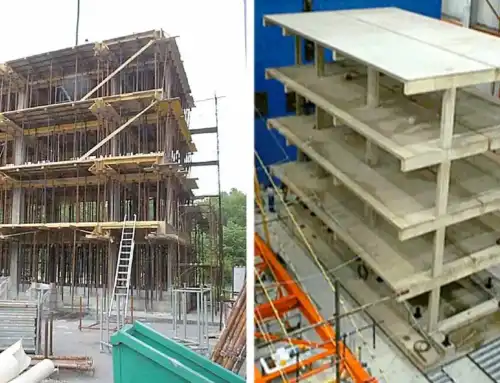
ASSESSMENT AND STRENGTHENING OF REAL 2-STOREY BUILDING
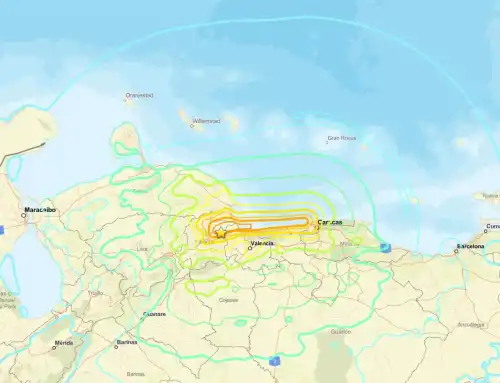
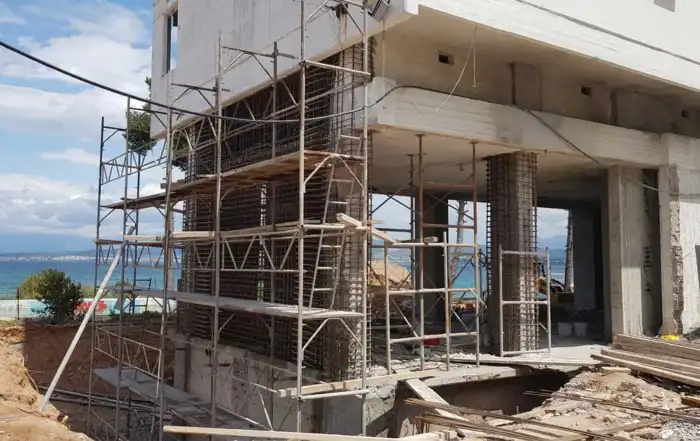
In this section the structural assessment and strengthening of a relatively small 2-storey residential building is presented. The building was constructed in the 1960s (first, ground floor) and the 1980s (second floor), and it had a soft ground floor with extremely weak columns, some of which were confined by infilled walls that form short columns. All the ground floor columns (18 in total) were damaged during the two 2014 Kefalonia earthquakes in Greece, of magnitudes 6.1 and 6.0, and four of the columns were very severely damaged with the complete deterioration of the concrete, the fracture of hoops and the local buckling of the longitudinal reinforcement (see [5] and Figure 6).
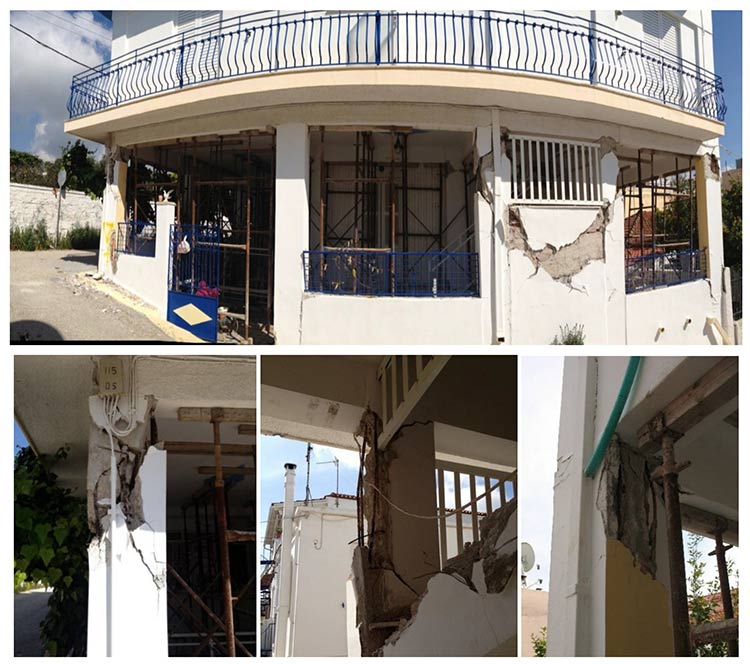
Figure 6: Damage sustained by the 2-story residential building
The concrete grade was found approximately equal to C16/20 and the steel grade was S220. The members were lightly reinforced, especially in shear (e.g., hoops Φ6/50 in the columns).
The building was analyzed according to the provisions of Eurocode 8, Part-3 for the Limit State of Significant Damage SD. The peak ground acceleration of the region is 0.36g and the analyses were carried out with a 10% probability of exceedance in 50 years, i.e. a return period of 475 years.
Capacity checks for the existing building
The checks have been carried out in shear and chord rotation for all the members. The values of the demand-to-capacity (DCR) ratios for the checks in shear and bending with the Nonlinear Static Procedure are displayed in Figure 7 and Figure 8, respectively. The maximum DCR ratios are 3.500 in shear and 2.803 for chord rotation. This is in accordance with the on-site, post-earthquake observations and indicates that the building would require strengthening even it was not damaged from the seismic events.
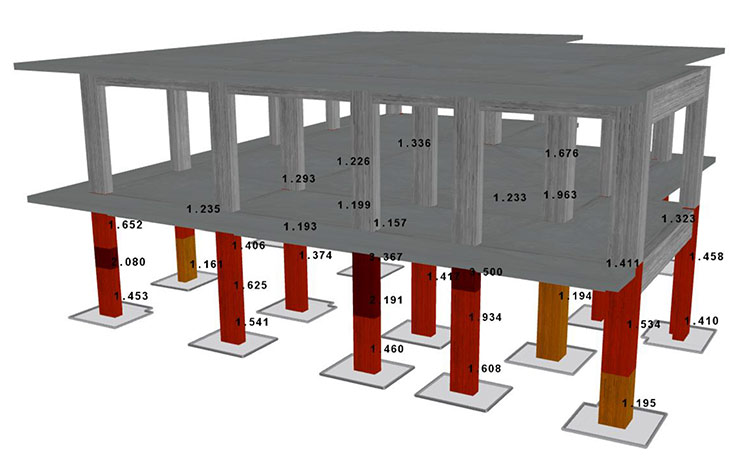
Figure 7: Shear checks with the Nonlinear Static Procedure, NSP
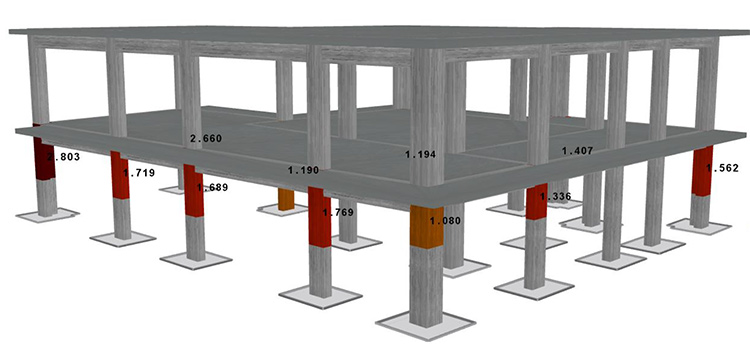
Figure 8: Chord rotation checks with the Nonlinear Static Procedure, NSP
It is noteworthy that the demand exceeds the capacity in all 18 columns of the ground level in shear, and in 11 out of the 18 ground floor columns in chord rotation, confirming again the increased vulnerability of soft ground stories and short columns in older, lightly reinforced buildings. What is also very interesting is the fact that the nonlinear static analysis of SeismoBuild managed to identify correctly the locations where increased damage occurred (for more information see [1]).
As expected, with the Nonlinear Dynamic Procedure the demand-to-capacity ratios are generally smaller (maximum DCR equal to 2.393 in shear and 0.659 in bending). What is more noteworthy however is that the DCR values fitted the locations and the extent of damage even better than the NSP (as explained in [1]), another indication that the NDP is the most accurate method for structural analysis.
On the contrary, with the Linear Dynamic Procedure the demand-to-capacity ratios are very high with values up to 6.720 in shear and 11.031 in bending. In total 43 out of the 80 structural elements have failed (Figure 9). Now the failures are not confined to the ground floor columns; in several beams of the first floor and columns of the second floor the demand exceeds the capacity. This differs from what has been observed from the post-earthquake survey, and it is yet another indication that the linear methods of analysis are not suitable for older, weak buildings.
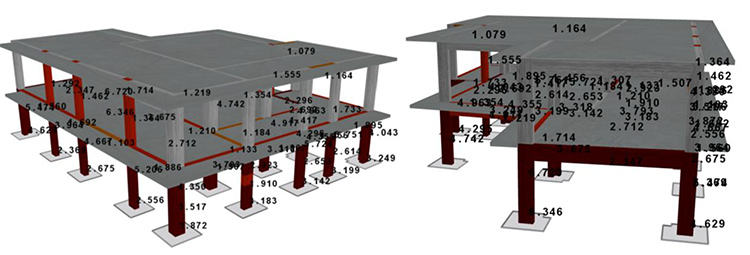
Figure 9: Shear checks with the Linear Dynamic Procedure, LDP
Seismic retrofit with reinforced concrete jackets
Because all the columns at the ground level were severely damaged, the construction of strong reinforced concrete jackets was actually the only technically acceptable solution for the strengthening of the building. The retrofit scheme consisted of the strengthening of all the columns at the soft storey with a 10 cm wide reinforced concrete jackets; the other structural members were left unstrengthened.
With the Nonlinear Static Procedure NSP none of the member fails. The maximum DCR ratios are now observed in the unstrengthened beams with values up to 0.982. For the columns that have been jacketed the maximum DCR is equal to 0.568, considerably smaller than the 3.500 value of the original structure (Figure 10). The maximum DCR in the vertical members is found on the second floor, which was not strengthened (DCR=0.978). Similar are the observations for the checks in chord rotation with a maximum DCR value equal to 0.413.
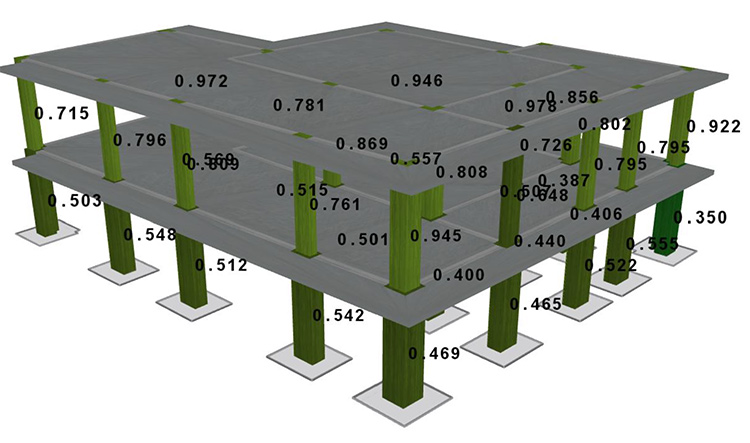
Figure 10: Shear checks in the strengthened building with the Nonlinear Static Procedure, NSP
With the Nonlinear Dynamic Procedure NDP the results are better in terms of the maximum demand-to-capacity ratios; the maximum DCR in shear is equal to 0.881, and the maximum DCR in chord rotation is 0.201.
With the Linear Dynamic Procedure LDP instead the results are extremely conservative. Although the jacketed columns of the ground floor withstand the demand, in total 27 members fail in shear and 33 members fail in bending. The maximum DCR values are 3.345 in shear and 10.331 in bending (Figure 11).
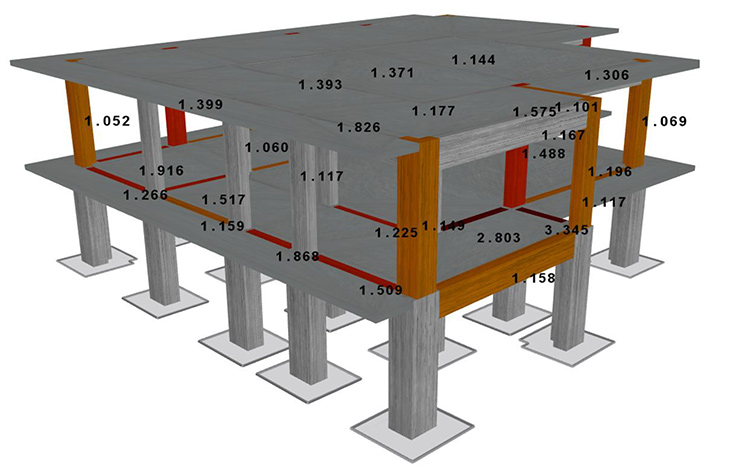
Figure 11: Shear checks in the strengthened building with the Linear Dynamic Procedure, LDP
Obviously, if the design of the strengthening scheme was based on the results from the linear dynamic analysis, the interventions would have been much more costly and more invasive, since retrofit of the components in the second (undamaged after the earthquake) floor would have also been required.
CONCLUSIONS
The outcome of the current investigation shows that the nonlinear methods are much more suitable for analyzing existing buildings. This is because the liner methods, due to the inherent inaccuracies, are overly conservative in their estimates of the seismic capacity and very frequently they lead to excessive interventions that are costly and cause significant and unnecessary disturbance in the operation of the building.
The use of nonlinear methods instead, combined with the good knowledge of the structural configuration can be very advantageous, and lead to lighter and less invasive interventions. In particular, the NSP is gradually becoming the ‘standard’ methodology for assessment and retrofit, because it is faster than the NDP, but also because of the simplicity in its application.
REFERENCES
[1] Antoniou, S. (2025). Linear vs. nonlinear procedures for the seismic assessment and retrofit of existing RC buildings. In Proceedings of the 10th International Conference on Computational Methods in Structural Dynamics and Earthquake Engineering (COMPDYN 2025) (Paper C 27254). Rhodes Island, Greece (Available at URL: https://2025.compdyn.org/proceedings/pdf/27254.pdf).
[2] Antoniou, S. Seismic Retrofit of Existing Reinforced Concrete Buildings, 1st Edition. John Wiley & Sons Ltd, 2023.
[3] F. Bianchi, M. Guidotti, R. Pinho, R. Nascimbene, Seismic assessment of RC buildings using linear analysis methods – an overly conservative practice. Proceedings of the 18th World Conference on Earthquake Engineering, WCEE 2024. 30 June – 5 July, 2024.
[4] Meral, E., Cayci, B.T. and Inel, M.. Comparative study on the linear and nonlinear dynamic analysis of typical RC buildings. Revista de la Construcción. Journal of Construction, 23(3), 587-607, 2024.
[5] Alfakat S.A. Repair and strengthening of a 2-storey residential building that was severely damaged during the 2014 Kefalonia earthquakes. Available at: https://www.alfakat.gr/en/project/repair-strengthening-building-severely-damaged-2014-kefalonia-earthquakes/ (Accessed: December 18, 2025).
[6] Structural Assessment, Strengthening & Retrofitting carried out using SeismoSoft Earthquake Engineering Software.


Great article highlighting the importance of quality materials in construction.